Add to my favorites
Remove from my favorites
Category: Continuous data
Simple statistics on one or two samples allows: GraphPad
Descriptive statistics and confidence interval of a mean; Grubbs' test to detect an outlier; t test; One sample t test; post test following two-way (or higher) ANOVA; confidence interval of a sum, difference, quotient or product of two means; Confidence interval of a standard deviation.
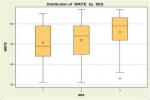
...continue to readBoxplotR is an interactive web application written in R for generation of customized box plots. Box Plots can be downloaded (Spitzer et al., Nat Meth 11:121, 2014).
...continue to readDescription not available.
...continue to readIn this site it is possible to calculate online Cohen's d and effect size correlation r
...continue to readThis page performs logistic regression, in which a dichotomous outcome is predicted by one or more variables. The program generates the coefficients of a prediction formula, and odds ratios. Data can be copied and pasted from files.
...continue to readThis page analyzes survival-time data by the method of Proportional Hazards regression (Cox). Given survival times, final status (alive or dead), and one or more covariates, it produces a baseline survival curve and covariate coefficient estimates with their standard errors, confidence intervals, and significance levels.
...continue to readPage: 1


